Your marketing numbers moved this week. They were always going to.
Traffic was up on Monday, down on Wednesday, weirdly high on Saturday. Your Google Ads cost per lead jumped in the second week of the month. Meta reach dropped, then recovered, without any changes to what you were doing.
None of that is necessarily a problem. But most business owners see movement and immediately assume something's wrong. So they start changing things (adjusting bids, rewriting ads, posting more, posting less) based on fluctuations that are completely normal and would have resolved on their own.
This is one of the most common ways marketing gets worse without anyone meaning to make it worse.
Marketing Performance Is Supposed to Move
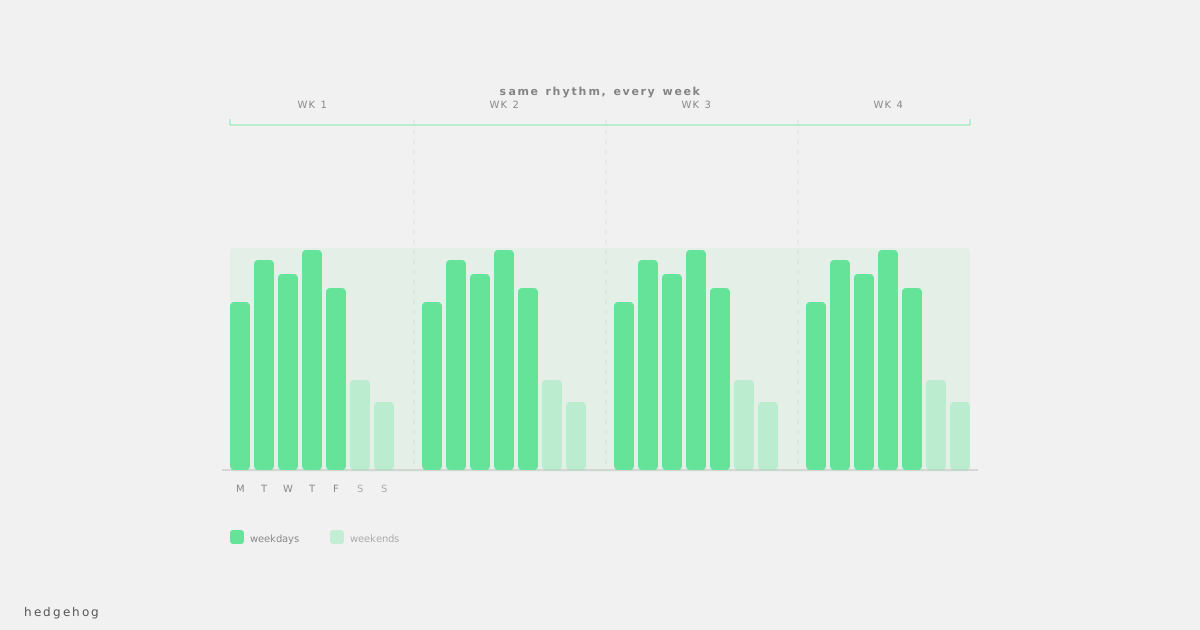
Every digital channel has inherent volatility. Google Ads performance shifts as competitor bids change, as auction dynamics fluctuate, as search volume rises and falls throughout the week. Organic social reach changes based on what else is happening on the platform that day. Website traffic has natural peaks and troughs tied to day of week, time of month, and what your audience is doing in the real world.
None of this is within your control, and none of it is a signal to act on in isolation.
The question isn't whether your numbers moved. They always move. The question is whether the movement is telling you something, or just the normal noise of any live marketing channel.
Noise vs. Signal
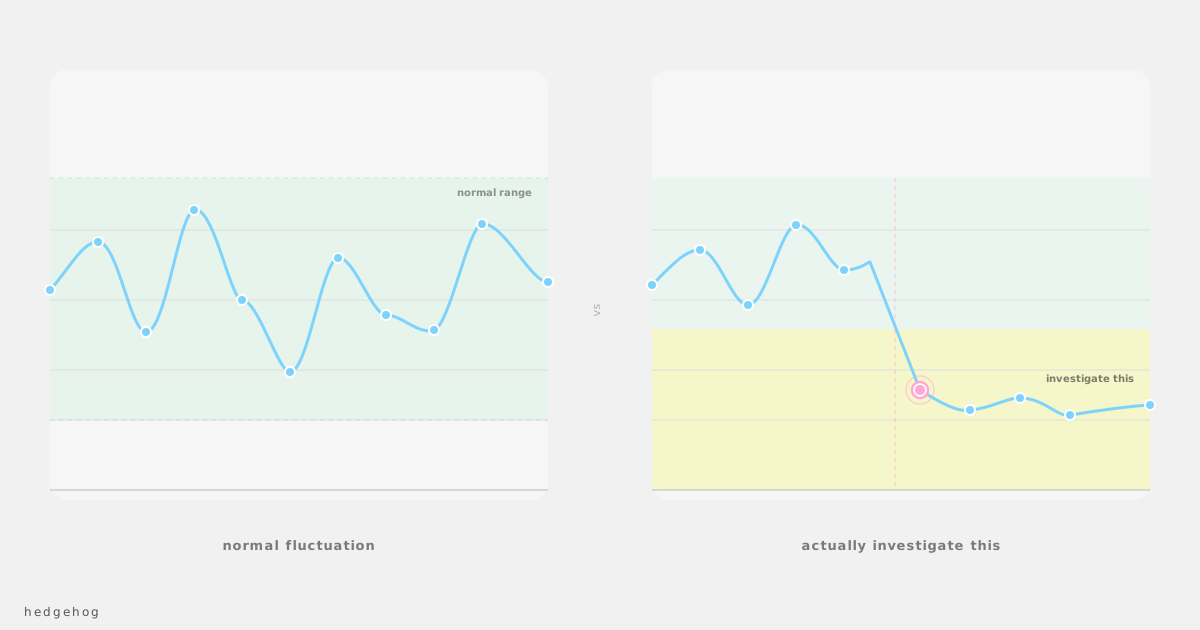
Noise is short-term, channel-specific, and usually self-correcting. A quiet week on organic social. A slightly higher CPA on Google Ads for ten days. A dip in website traffic over a long weekend.
A signal is sustained, often multi-channel, and doesn't reverse on its own. A consistent drop across four or more weeks. Performance declining across Google Ads and organic simultaneously. Leads falling while your spend stays constant, and that pattern holding across a full month.
The biggest mistake is treating noise like a signal. When you make strategy changes in response to two bad weeks, you're optimising based on insufficient data. You often make things worse, and then attribute the further decline to the original problem rather than to your own intervention.
How to Tell the Difference
Three weeks of data is the minimum before drawing any meaningful conclusion. For most metrics, four to six weeks gives you something reliable to work with.
Before investigating a drop, check a few things.
Is this seasonal? Many businesses have predictable quiet periods they forget about between years. Pull the same period from twelve months ago. If you were quiet then too, you're probably just experiencing your seasonal pattern.
Is it one channel or all channels? If your Google Ads performance dips but organic traffic is steady and leads are holding, the issue is channel-specific. If everything drops simultaneously, that's worth investigating properly.
Did anything change on your end? A landing page update. A budget reduction. A tracking issue. These cause performance drops that look like external problems but have internal explanations.
Is there a metric disconnect? If traffic is steady but conversions drop sharply, something in the conversion path has changed: a form breaking, a page loading slowly, an offer that's expired. The drop isn't about traffic at all.
Year-Over-Year Is the Right Comparison
Week-over-week comparisons are useful for spotting sudden, sharp changes. Month-over-month gives you a reasonable trend indicator. But year-over-year is what actually controls for the variables you can't change: seasonality, industry cycles, the natural rhythm of your market.
A 15% drop month-over-month looks alarming. The same drop compared to the same month last year, during what you now remember was your slow season, looks like Tuesday.
Build your reporting around year-over-year comparisons and you'll make fewer panicked decisions based on patterns that were always there. You just hadn't seen them enough times to recognise them.
When to Actually Act
Some movement does warrant a response. Sustained declines over four or more weeks outside your slow season. A sharp drop that doesn't recover after two weeks. Metrics moving in opposite directions: traffic climbing while leads fall, spend increasing while conversions don't. These are signals, not noise.
When you do act, change one thing at a time. The impulse when performance drops is to adjust everything at once: the targeting, the creative, the budget, the landing page. But if you change five things and performance recovers, you have no idea what fixed it. And if it doesn't recover, you don't know what made it worse.
What Good Reporting Looks Like
Review your marketing performance monthly, not daily. Track trends, not individual weeks. Compare to the same period last year before drawing any conclusions. Pick a small number of metrics you actually act on, not everything your dashboard will show you, and review those consistently.
You'll still see movement. You'll just stop confusing it with meaning.